Question: how well off is a typical household in each rich country once you count the health care, schooling and social care it receives besides its cash income? The short answer: counting services closes about half of the United States' cash lead over Western Europe. Norway, Luxembourg, the Netherlands and Denmark come out level with or above the US, and Canada sits at 89 (US = 100).
The starting point is median disposable household income: what the middle household has after taxes and cash transfers, adjusted for household size, from the OECD Income Distribution Database, in US dollars at purchasing power parity (PPP), so prices are comparable. To that I add the per-person value of public and insured health care, public education and other in-kind social services (elder, disability and child care, housing). Each service is valued at what is spent on it, converted at its own price level, so expensive US health care counts for less than its dollar cost.
Values are per household-size-adjusted adult, in US dollars. Services are each country's per-person spending times 1.5, the same values the ranking uses. The exchange-rate row converts cash income at that year's market exchange rate instead of PPP, so it shows what the income buys in dollars, not at home. You can link to a comparison: the address updates when you pick.
against
| Measure | Difference | Ratio |
|---|
Click a column header to sort. Index columns put the US at 100. Cash only: median disposable income. Plus health and education: version 3. Plus all services: version 5. Mean consumption: the OECD's official actual individual consumption per person, a mean rather than a median, shown as a cross-check.
| Country | Year | Median cash income | Income plus all services | Cash only | Plus health and education | Plus all services | Mean consumption | |
|---|---|---|---|---|---|---|---|---|
| Luxembourg | 2023 | $66,476 | $86,639 | 133 | 120 | 125 | 100 | |
| Norway | 2023 | $54,376 | $80,109 | 109 | 106 | 116 | 85 | |
| Netherlands | 2024 | $50,677 | $72,082 | 102 | 99 | 104 | 86 | |
| Denmark | 2022 | $39,267 | $69,628 | 79 | 87 | 100 | 71 | |
| United States | 2023 | $49,885 | $69,258 | 100 | 100 | 100 | 100 | |
| Austria | 2023 | $50,562 | $67,916 | 101 | 96 | 98 | 79 | |
| Sweden | 2024 | $44,436 | $67,554 | 89 | 87 | 98 | 74 | |
| Belgium | 2023 | $45,184 | $66,439 | 91 | 91 | 96 | 78 | |
| Germany | 2023 | $43,047 | $66,201 | 86 | 90 | 96 | 82 | |
| Switzerland | 2023 | $47,605 | $63,321 | 95 | 91 | 91 | 80 | |
| Finland | 2024 | $40,358 | $62,789 | 81 | 82 | 91 | 73 | |
| New Zealand | 2022 | $38,320 | $61,842 | 77 | 81 | 89 | 67 | |
| Canada | 2023 | $46,123 | $61,618 | 92 | 89 | 89 | 72 | |
| Ireland | 2023 | $42,785 | $60,989 | 86 | 86 | 88 | 68 | |
| France | 2023 | $38,752 | $60,646 | 78 | 84 | 88 | 73 | |
| Iceland | 2019 | $35,043 | $58,479 | 70 | 77 | 84 | 83 | |
| Korea | 2023 | $42,543 | $56,166 | 85 | 78 | 81 | 56 | |
| Australia | 2020 | $36,203 | $55,094 | 73 | 74 | 80 | 78 | |
| Slovenia | 2023 | $38,519 | $52,599 | 77 | 75 | 76 | 58 | |
| United Kingdom | 2023 | $35,136 | $52,223 | 70 | 72 | 75 | 77 | |
| Spain | 2023 | $37,969 | $51,920 | 76 | 74 | 75 | 63 | |
| Israel | 2023 | $33,830 | $49,069 | 68 | 68 | 71 | 56 | |
| Italy | 2023 | $36,387 | $48,771 | 73 | 70 | 70 | 68 | |
| Czechia | 2023 | $28,821 | $46,704 | 58 | 66 | 67 | 56 | |
| Poland | 2023 | $32,143 | $45,796 | 64 | 66 | 66 | 57 | |
| Estonia | 2023 | $28,044 | $40,814 | 56 | 58 | 59 | 52 | |
| Lithuania | 2023 | $25,094 | $39,250 | 50 | 54 | 57 | 60 | |
| Latvia | 2023 | $27,270 | $38,224 | 55 | 53 | 55 | 50 | |
| Slovak Republic | 2023 | $23,107 | $37,786 | 46 | 53 | 55 | 53 | |
| Portugal | 2023 | $25,673 | $37,359 | 52 | 54 | 54 | 59 | |
| Romania | 2023 | $22,519 | $35,949 | 45 | 51 | 52 | 57 | |
| Bulgaria | 2023 | $23,138 | $35,634 | 46 | 49 | 52 | 48 | |
| Hungary | 2023 | $19,741 | $32,111 | 40 | 43 | 46 | 48 | |
| Türkiye | 2022 | $12,897 | $30,931 | 26 | 44 | 45 | 45 | |
| Greece | 2023 | $21,905 | $30,852 | 44 | 45 | 44 | 55 | |
| Chile | 2022 | $13,797 | $27,309 | 28 | 37 | 39 | 38 | |
| Costa Rica | 2025 | $15,339 | $22,311 | 31 | 32 | 32 | 36 | |
| Mexico | 2022 | $8,381 | $19,149 | 17 | 27 | 28 | 31 |
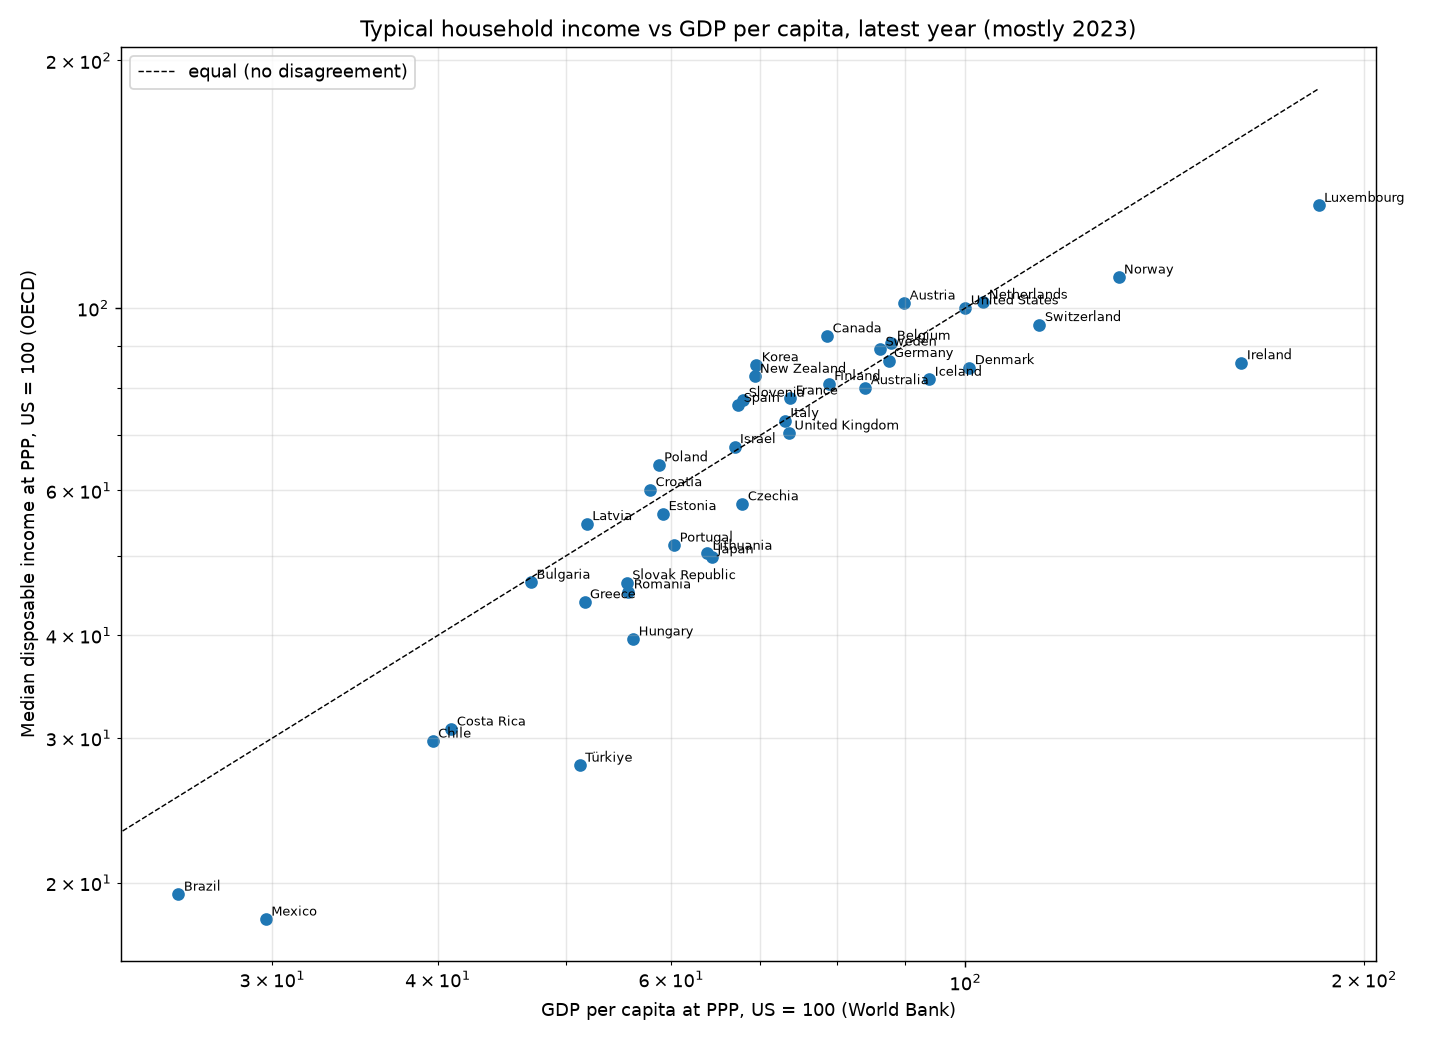
GDP per person measures output, not what households receive. Countries below the diagonal give their typical household less than their output suggests: Ireland and Luxembourg because multinational profits and cross-border commuters inflate GDP, Latin America and Turkey because of inequality.
US states are computed from the Census Current Population Survey (CPS) March 2024 microdata and adjusted for each state's prices with the Bureau of Economic Analysis (BEA) regional price parities. Provinces use Statistics Canada's median adjusted after-tax income and are not adjusted for price differences within Canada. States within about 5% of each other are not reliably ranked.
| Place | Type | Median disposable income, 2023, US$ PPP |
|---|---|---|
| Luxembourg | Country | $66,476 |
| District of Columbia | US state | $65,675 |
| Northwest Territories | Canadian province | $65,515 |
| New Hampshire | US state | $63,643 |
| South Dakota | US state | $60,416 |
| North Dakota | US state | $60,072 |
| Colorado | US state | $59,386 |
| Massachusetts | US state | $59,294 |
| Iowa | US state | $59,242 |
| Yukon | Canadian province | $58,627 |
| Nebraska | US state | $58,142 |
| Kansas | US state | $57,677 |
| Vermont | US state | $57,319 |
| Virginia | US state | $56,905 |
| Connecticut | US state | $56,631 |
| Alaska | US state | $56,352 |
| Wisconsin | US state | $56,237 |
| Utah | US state | $55,518 |
| Montana | US state | $55,310 |
| Missouri | US state | $54,999 |
| Ohio | US state | $54,916 |
| Maryland | US state | $54,860 |
| Minnesota | US state | $54,490 |
| Delaware | US state | $53,566 |
| New Jersey | US state | $53,383 |
| Wyoming | US state | $53,094 |
| Washington | US state | $52,817 |
| Rhode Island | US state | $52,689 |
| Tennessee | US state | $52,573 |
| Illinois | US state | $52,366 |
| Indiana | US state | $52,166 |
| Arizona | US state | $52,152 |
| Michigan | US state | $51,989 |
| Pennsylvania | US state | $51,495 |
| Maine | US state | $50,647 |
| Oregon | US state | $50,308 |
| United States | Country | $49,885 |
| Hawaii | US state | $49,660 |
| Idaho | US state | $49,568 |
| British Columbia | Canadian province | $49,342 |
| Nevada | US state | $49,149 |
| Texas | US state | $48,901 |
| Alberta | Canadian province | $48,893 |
| Oklahoma | US state | $48,341 |
| South Carolina | US state | $47,952 |
| Arkansas | US state | $47,720 |
| Ontario | Canadian province | $47,695 |
| West Virginia | US state | $46,846 |
| New York | US state | $46,495 |
| Kentucky | US state | $46,362 |
| Georgia | US state | $46,342 |
| North Carolina | US state | $46,192 |
| Canada | Country | $46,123 |
| California | US state | $45,574 |
| Alabama | US state | $45,509 |
| Nunavut | Canadian province | $45,000 |
| Saskatchewan | Canadian province | $44,925 |
| Florida | US state | $44,166 |
| New Mexico | US state | $44,109 |
| Quebec | Canadian province | $43,277 |
| Prince Edward Island | Canadian province | $42,529 |
| Manitoba | Canadian province | $42,079 |
| Louisiana | US state | $41,765 |
| Newfoundland and Labrador | Canadian province | $41,705 |
| New Brunswick | Canadian province | $40,283 |
| Mississippi | US state | $40,277 |
| Nova Scotia | Canadian province | $40,133 |
Data retrieved 2026-10-31 and 2026-11-01.